Katie Meyers
Lab Project Two: Exercise Physiology
For this lab, I decided to pick three rather unique experiments. My first activity/experiment was measuring my basic body metabolic parameters while listening to a fast jig from the “Pirates of the
My hypothesis: When I listen to the “Pirates” piece of music, all four measurements will be higher than my baseline measurements, because the music will excite my emotions and body response. When I listen to the “Harry Potter” piece of music, my pulse and respiration rate will be higher than my baseline measurements, since the music is still emotional, though this music is much slower than the music in activity one. However, I think my blood pressure will be lower, since the music also relaxes me physically. In my third activity, since I will not be sitting and listening to music, but rather standing and physically producing music, all four measurements will be higher than my baseline measurements. In fact, I would say the highest measurements for each category (systolic bp, diastolic bp, respiration, pulse) will be the highest of them all in activity three.
HOW DO I THINK MY METABOLIC RATES WILL COMPARE TO BASELINE AFTER:
| | PULSE | RESPIRATION RATE | BP SYSTOLIC | BP DIASTOLIC |
| ACTIVITY ONE: Pirates of the | Higher than baseline | Higher than baseline | Higher than baseline | Higher than baseline |
| ACTIVITY TWO: Harry Potter and the Goblet of Fire Soundtrack; Track 12, “Harry In Winter” (slow melody) | Higher than baseline | Higher than baseline | Lower than baseline | Lower than baseline |
| ACTIVITY THREE: Playing on violin the 3rd movement of Barber’s violin concerto (Presto, very fast) | Higher than baseline | Higher than baseline | Higher than baseline | Higher than baseline |
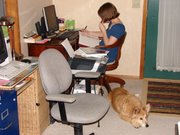
I began by my dad and me measuring my baseline measurements. Then, my mom and dad measured my rates five different times while I listened to the same track of the “Pirates of the Then, we did the same thing with my “Harry Potter and the Goblet of Fire” soundtrack, from which I listened to the same track over and over as they measured my rates five different times. (Again, my mom took this picture, but she helped take other rates besides my blood pressure when she was not behind the camera.) For my third project, my parents waited while I played the first page of the third movement of Barber’s violin concerto. Total, I played it five times. After each time through, my parents would help take all four measurements. Here is the raw data table of my experiment results Systolic Blood Pressure Diastolic Blood Pressure Respiration Rate (per minute) Pulse (per minute) Baseline 1 110 65 18 76 Baseline 2 108 62 20 70 Baseline 3 100 60 18 84 Baseline 4 100 64 18 76 Baseline 5 100 64 20 84 Activity One, 1 102 60 22 78 Activity One, 2 102 62 20 78 Activity One, 3 98 64 21 88 Activity One, 4 102 64 18 88 Activity One, 5 98 66 20 88 Activity Two, 1 98 58 10 84 Activity Two, 2 98 62 14 88 Activity Two, 3 100 58 10 82 Activity Two, 4 96 62 12 80 Activity Two, 5 97 60 10 84 Activity Three, 1 102 64 30 126 Activity Three, 2 98 64 28 126 Activity Three, 3 98 65 36 120 Activity Three, 4 98 70 30 120 Activity Three, 5 98 76 28 122 Here is my bar graph comparing the averages of systolic blood pressure from each experiment and my baseline measurements. Here is my bar graph comparing the averages of diastolic blood pressure from each experiment and my baseline measurements. Here is my bar graph depicting the average activity and baseline respiration rates. Lastly, here is my bar graph showing the average pulse rates for baseline and each activity. Data Analysis; comparing results with hypothesis: My results both agreed and disagreed with my hypotheses. With my systolic blood pressure, I was surprised to find that my highest readings were my baseline readings. This may be because I was a little nervous and excited to begin this project, since my raw data table shows that my systolic blood pressure lowered a bit by my third baseline measurement. Since I hypothesized that my systolic blood pressure taken during and after my activities would be higher than my baseline, my systolic blood pressure hypothesis has been proven false this time. However, I did hypothesize that my systolic blood pressure would be lower in my second activity than in my baseline measurements. In that case, my hypothesis was proven true here. As for diastolic blood pressure, I hypothesized that my measurements for activities one and three would be higher than my baseline measurements, while my measurements for activity two would be lower. Other than the fact that my first activity’s measurements are equal rather than higher than my baseline measurements, my hypothesis is shown true by my results. I hypothesized that my respiration rates would be higher during my activities than during my baseline measurements. This was proven true in activities one and three, especially three, when I was standing and physically working. However, I was surprised to see how much my respiration rate lowered compared to my baseline measurements during my second experiment. My reasoning for these results is that that particular piece of music relaxed me, and it was greatly evidenced by how my respiration rate numbers came out. So, two-thirds of my respiration hypothesis was proven true, while one-third was proven false. Lastly, I hypothesized my pulse rate measurements in all three activities would be higher than my baseline measurements for pulse rate. This was proven true by these experiments. In both of my listening experiments, my pulse stayed about the same, despite the tempo difference in the two musical selections. However, not surprisingly, my pulse rate rose greatly when I was working to play the violin. Overall, a greater percentage of my hypotheses were proven true. However, there was also a noticeable (though smaller) portion of my hypotheses that were proven false. Other than human error on me and my parents’ parts, I think that there were as few problems with our data and technique as was possible. True, my dad is not an electronic blood pressure cuff, but I trust he knew what he was doing, as he has been educated in how to take blood pressure, due to the schooling he went through for his job. In my violin experiment, it would have been nice to have been able to take my measurements while playing, but that would have been very difficult and unreasonable for all involved. Due to the majority of my hypotheses being proven correct in this instance, I think I had a reasonably good original idea of what my experiments would result in. I realize that this did not turn out as an “exercise physiology” experiment, exactly. However, I think I still learned some valuable things from this experience. First of all, I was interested to see how emotions brought on by music would physically affect the patient (me). In some cases, listening to music did affect my readings. However, they did not affect them nearly as much as I expected. On the other hand, my physical activity readings (from playing a fast violin piece) did show what I expected. However, I know that string players are known for almost holding their breath when they play because their body is so busy with other activities. In that way, it would have been neat to measure my respiration rate when I was playing, as well as afterwards, and see the difference. However, as I stated earlier, that would have been difficult to do, and did not happen. In the end, my general idea of the power of emotions on the physical reactions of the body was still overshadowed by common sense and knowledge: when working harder physically, my overall basic body metabolic parameters read higher than anything else. This proves that my circulatory system needed to work harder, since I needed more oxygen to play the violin than to listen to music.
What I used for this experiment: notebook, mechanical pencil, portable CD player with big headphones, sphygmomanometer, “Harry Potter and the Goblet of Fire” soundtrack, “Pirates of the Caribbean: At World’s End” soundtrack, violin and bow, stethoscope, first page of the third movement of Samuel Barber’s violin concerto, clock with a hand that counts seconds, my very nice dad (who’s an optometrist) who measured my blood pressure and other rates, my kind mom who helped me measure other rates like respiration and pulse.


No comments:
Post a Comment